


Cycling tour guide business financial model


5-Year Financial Projections
100% Editable
Investor-Approved Valuation Models
MAC/PC Compatible, Fully Unlocked
No Accounting Knowledge Needed
Cycling Tour Guide Business Bundle
This ready-made cycling tour guide business financial model template tackles the core challenges founders face, emphasizing accuracy, usability, and industry relevance. Tailored for bike tour companies offering guided cycling tours and scenic cycling routes, it streamlines financial planning for eco-friendly bike tours and cultural cycling experiences. Save valuable time while making data-driven decisions that impress stakeholders and support growth in cycling adventure tours and bike rental and tours sectors.
Cycling Tour Guide Business Financial Model Template : Features
Fully Customizable Financial Model
Our Cycling Tour Guide Business financial model template comes pre-filled with industry-specific formulas and assumptions tailored for bike tour companies. It streamlines forecasting for guided cycling tours, scenic cycling routes, and eco-friendly bike tours, making it simple to customize for any cycling adventure tours or group cycling excursions concept.
- Startup and equipment investment
- Pricing strategies for customized cycling packages
- Staffing costs for expert cycling guides
- Operational and maintenance expenses

Comprehensive 5-Year Financial Projections
For any cycling tour guide or bike tour company, long-term planning with detailed projections is critical. This financial model offers tailored revenue and cost forecasts, capturing nuances of guided cycling tours, eco-friendly bike tours, and scenic cycling routes. You can accurately project profits and make data-driven decisions for customized cycling adventure packages and family-friendly guided bike tours.
- Monthly revenue forecasts
- Annual financial projections
- Break-even analysis
- Profitability insights by tour type

Startup Costs and Running Expenses
Plan your cycling tour guide business launch and daily operations with a comprehensive cost breakdown. This model clarifies initial investments and ongoing expenses essential for running a bike tour company focused on scenic cycling routes and high-quality bike rental and tours.
- Specialized cycling equipment and maintenance
- Training and salaries for expert guides
- Marketing for cultural cycling experiences and eco-friendly bike tours
- Licenses, insurance, and permits for guided cycling tours

Break-Even Analysis
Determine precisely when your cycling tour guide business will achieve profitability by leveraging break-even analysis tailored for bike tour companies. Pinpoint the sales volume needed to cover fixed and variable costs on scenic cycling routes, ensuring your guided cycling tours transition into sustainable revenue streams efficiently and confidently.
- Revenue vs. cost projections
- Fixed and variable cost analysis
- Break-even sales volume
- Profitability tracking

Built-In Industry Benchmarks
Assess your cycling tour guide business against industry benchmarks tailored for bike tour companies and guided cycling tours. This model integrates metrics essential for cycling adventure tours, such as customer acquisition costs and average tour size, allowing you to measure profitability and operational efficiency versus eco-friendly bike tours and cultural cycling experiences standards.
- Average revenue per guided cycling tour
- Cost per bike rental and tours package
- Gross profit margins on scenic cycling routes
- Customer retention rates for group cycling excursions

Multi-Platform Compatibility
Manage your Cycling Tour Guide Business financial model with unmatched flexibility, whether you use Microsoft Excel on Windows or Mac, or Google Sheets for seamless, real-time collaboration. This compatibility ensures you can update projections for your guided cycling tours and bike tour company easily and access your data anywhere.
- Works on Excel for Windows and Mac
- Collaborative editing in Google Sheets
- Accessible across multiple devices

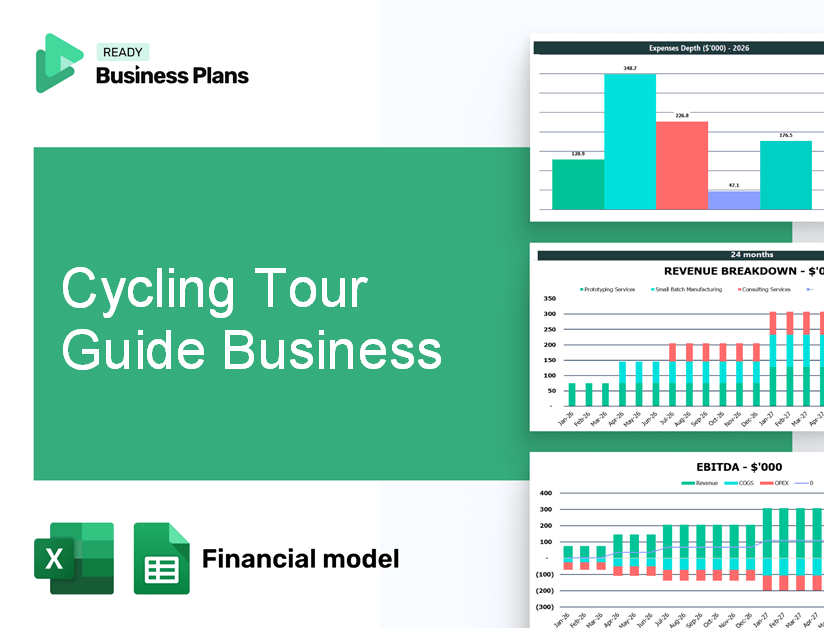
Visual Dashboard with Key Metrics
Visualizing your Cycling Tour Guide Business’s financials through a dynamic dashboard simplifies tracking revenue from bike rental and tours, monitoring expenses tied to scenic cycling routes, and assessing profitability of your guided cycling tours. This clear, data-driven display helps you easily present progress and insights to investors or partners.
- Revenue streams from customized cycling adventure packages
- Expense allocation for eco-friendly bike tours
- Profit margins on family-friendly guided bike tours
- Key performance indicators (KPIs) for group cycling excursions

Scenario Planning for Seasonal Variations
Navigate seasonal fluctuations in your cycling tour guide business with precision. This financial model simulates revenue shifts linked to peak tourist seasons and off-peak periods, incorporating variables such as demand for scenic cycling routes and high-quality bike rental and tours. Adjust staffing and cost structures to maintain profitability across cycling adventure tours and group cycling excursions all year round.
- Seasonal revenue projections for guided cycling tours
- Cost adjustment simulations including eco-friendly bike tours expenses
- Staffing requirement analysis for multi-day cycling tours with accommodations
- Profitability tracking in peak and off-peak months for cycling tours showcasing local culture

Investor-Ready Presentation
Present your cycling tour guide business with a sleek, professional financial model crafted specifically for bike tour companies focused on guided cycling tours and scenic cycling routes. The polished formatting and clear structure help you effectively showcase customized cycling adventure packages and eco-friendly bike tours, making it easier to gain trust from investors, banks, or partners.
- Clear revenue and cost summaries
- Polished visual reports
- Professional formatting
- Detailed assumption breakdown

How to Use the Template

Download and Open
Simply purchase and download the financial model template, then access it instantly using Microsoft Excel or Google Sheets. No installation or technical expertise required—just open and start working.

Input Key Data:
Enter your business-specific numbers, including revenue projections, costs, and investment details. The pre-built formulas will automatically calculate financial insights, saving you time and effort.

Analyse Results:
Leverage the investor-ready format to confidently showcase your financial projections to banks, franchise representatives, or investors. Impress stakeholders with clear, data-driven insights and professional reports.

Present to Stakeholders:
Leverage the investor-ready format to confidently present your projections to banks, franchise representatives, or investors.